StockFetcher Forums · Stock Picks and Trading · Using Guppy GMMA - Put AMBA on pullback watch list buy in today.<< 1 2 >>Post Follow-up
graftonian
1,089 posts
msg #130845
Remove message
9/3/2016 7:46:08 PM

Fetcher[
market is not OTCBB
Average Volume(30) > 1000000

/*short term*/
draw WMA(5) and draw WMA(7) and draw WMA(9) and draw WMA(11)
draw WMA(13) and draw WMA(15)

set{SS57, count(WMA(5) > WMA(7), 1)}
set{SS79, count(WMA(7) > WMA(9), 1)}
set{SS911, count(WMA(9) > WMA(11), 1)}
set{SS1113, count(WMA(11) > WMA(13), 1)}
set{SS1315, count(WMA(13) > WMA(15), 1)}
set{ss1, SS57 + SS79}
set{ss2, ss1 + SS911}
set{ss3, ss2 + SS1113}
set{short_term_score, ss3 + SS1315}

/*long term*/
draw WMA(70) and draw WMA(60) and draw WMA(50) and draw WMA(45)
draw WMA(40) and draw WMA(35) and draw WMA(30)

set{LS6070, count(WMA(60) > WMA(70), 1)}
set{LS5060, count(WMA(50) > WMA(60), 1)}
set{LS4550, count(WMA(45) > WMA(50), 1)}
set{LS4045, count(WMA(40) > WMA(45), 1)}
set{LS3540, count(WMA(35) > WMA(40), 1)}
set{LS3035, count(WMA(30) > WMA(35), 1)}
set{LS1, LS6070 + LS5060}
set{LS2, LS1 + LS4550}
set{LS3, LS2 + LS4045}
set{LS4, LS3 + LS3540}
set{long_term_score, LS4 + LS3035}

draw long_term_score
draw short_term_score
set{comp_score, long_term_score + short_term_score}
set{100_day_slope, 2 day slope of MA(100)}
DRAW COMP_SCORE
DRAW COMP_SCORE LINE AT 6

draw 100_day_slope
draw 100_day_slope line at 0

add column short_term_score
add column long_term_score
add column comp_score
SORT ON COLUMN 7 ASCENDING
add column 100_day_slope

SHORT_TERM_SCORE 2 DAYS AGO > 0
SHORT_TERM_SCORE 1 DAY AGO > SHORT_TERM_SCORE 2 DAYS AGO
CHART-TIME IS 6 MONTHS
/*FOR BACKTEST*/
COMP_SCORE CROSSED ABOVE 6
DRAW RSI(9)
]


graftonian
1,089 posts
msg #130853
Remove message
9/4/2016 10:27:34 AM

Mac, I agree it would be nice if one could choose the color of lines drawn. Scottrade elite has this feature, and the charts are much more readable. Also, one can choose different colors for up and down trends

graftonian
1,089 posts
msg #131132
Remove message
9/13/2016 10:23:13 AM

Mac, Using this GMMA technique, when do you feel SPXU will be a buy? Or is it there allready?

Mactheriverrat
3,178 posts
msg #131245
Remove message
modified
9/17/2016 11:48:40 PM

Submit
Fetcher[and draw eMA(3) on plot price
and draw EMA(5) on plot price
and draw EMA(7) on plot price
and draw EMA(9) on plot price
and draw EMA(11) on plot price
and draw EMA(13) on plot price


and draw EMA(21) on plot price
and draw EMA(24) on plot price
and draw EMA(27) on plot price
and draw EMA(30) on plot price
and draw EMA(33) on plot price
and draw EMA(36) on plot price

and EMA(21) is above EMA(21) one day ago

Market is not otcbb
market is not etf
volume is above 100000
Average Day Range(30) is above 4.00
do not draw Average Day Range(30)
add column Average Day Range(30)
chart-time is 4 months
chart-type is ohlc

DxD is number of consecutive days EMA(5) above (+)/below(-) previous EMA(5) and set{DDb,days( EMA(5) is above EMA(5) 1 day ago,100)}
set{DDa,days( EMA(5) is below EMA(5) 1 day ago,100)} set{DxD, DDa - DDb} and add column DxD {D_x_D}

do not Draw DxD

ExE is number of consecutive days EMA(21) above (+)/below(-) previous EMA(21) and set{EEb,days( EMA(21) is above EMA(21) 1 day ago,100)}
set{EEa,days( EMA(21) is below EMA(21) 1 day ago,100)} set{ExE, EEa - EEb} and add column ExE {E_x_E}

do not Draw ExE

Set{cntema3,count(ema(3)> ema(3) 1day ago,1)}
draw cntema3

Set{cntema3b,count(ema(3)< ema(3) 1day ago,1)}
draw cntema3b

Set{cntema7c,count(ema(7)> ema(7) 1day ago,1)}
draw cntema7c

Set{cntema21c,count(ema(21)> ema(21) 1day ago,1)}
draw cntema21c


]


Not a bad video. It shows basic Guppy idea . Watch how the EMA(3) and EMA(5) has its first day up in a strong trend. The person who made missed a few shot's but it give's the user at least a idea.
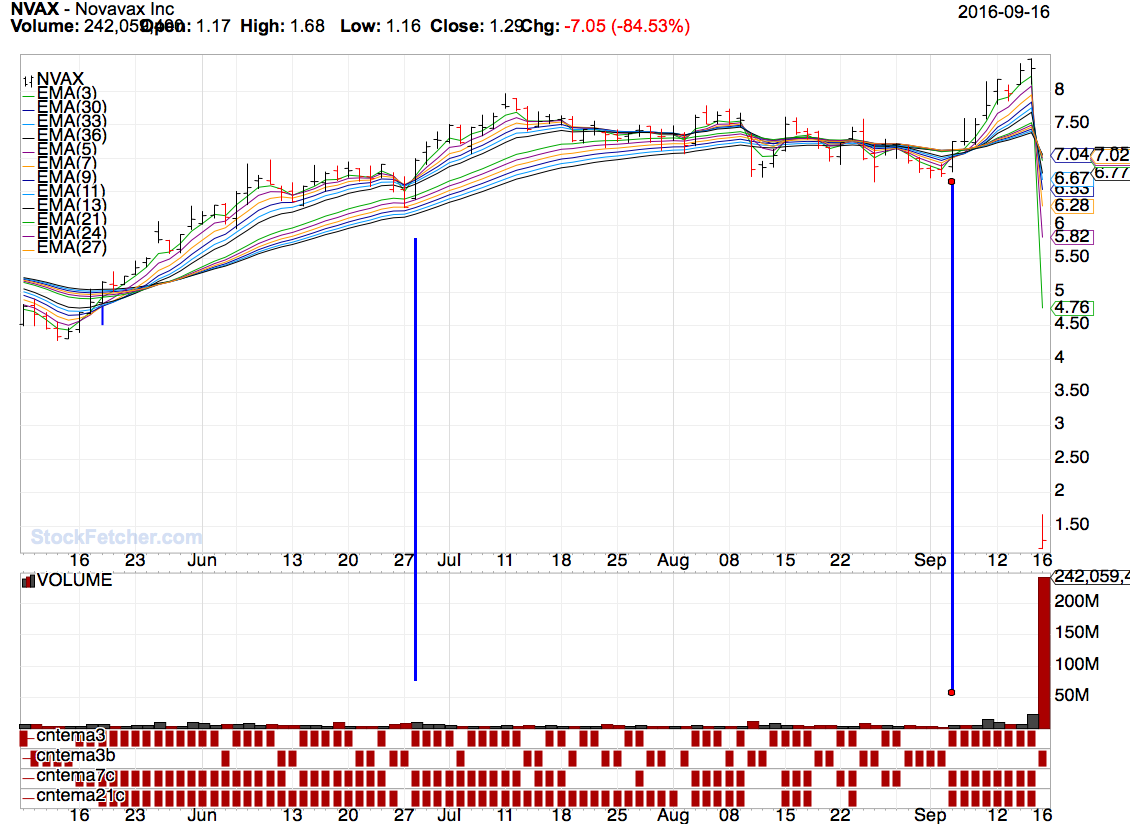


Colored Box's are below -
1st- EMA(3) above EMA(3) one day ago
2nd -EMA(3) below EMA(3) one day ago
3rd -EMA(7) above EMA(7) one day ago
4th - EMA(21) above EMA(21) one day ago
5th - DxD is where one can sort by EMA(3) for day 1
6th - ExE is a look at the EMA(21)
The longer term investor's are the Alan Hull version not the true guppy 30 to 60 EMA's.

One can add his or her own indicator's . I think the less the better. IMHO.
One can change the Volume to more and the Average Day Range(30) to less to narrow down stocks,

Mactheriverrat
3,178 posts
msg #131247
Remove message
9/18/2016 1:14:20 AM

@ Graf All stocks like SPXU,TVIX, UVXY and other's wouldn't use longer term average's As you can see SPXU longer average's are just to a squeeze and not rolling over not saying that they won't. Look what SPXU has acted in the past.

graftonian
1,089 posts
msg #131258
Remove message
9/18/2016 1:22:36 PM

Mac, Watched the video, plus another by Daryl Guppy. Alot of interesting ideas. I am working on 2 filters,one to measure how the long term and short term averages are "stacked", and the other to measure the compression and expansion of the two groups. Will post when I get them cleaned up.

graftonian
1,089 posts
msg #131265
Remove message
9/18/2016 7:59:37 PM

There are two filters in the following code, one for reversals in long term trend and another (commented out) for short dips in long trend.
Fetcher[
/*Guppy MMA, sep 18*/
market is not OTCBB
Average Volume(30) > 1000000

/*short term*/
draw EMA(3)
draw EMA(5)
draw EMA(7)
draw EMA(9)
draw EMA(11)
draw EMA(13)

/*A point for each pair stacked right*/
set{SS35, count(EMA(3) > EMA(5),1)}
set{SS57, count(EMA(5) > EMA(7), 1)}
set{SS79, count(EMA(7) > EMA(9), 1)}
set{SS911, count(EMA(9) > EMA(11), 1)}
set{SS1113, count(EMA(11) > EMA(13), 1)}

set{ss1, SS35 + SS57}
set{ss2, ss1 + SS79}
set{ss3, ss2 + SS911}
set{short_term_score, ss3 + SS1113}

/*long term*/
draw EMA(70)
draw EMA(60)
draw EMA(50)
draw EMA(40)
draw EMA(35)
draw EMA(30)

set{LS6070, count(EMA(60) > EMA(70), 1)}
set{LS5060, count(EMA(50) > EMA(60), 1)}
set{LS4050, count(EMA(40) > EMA(50), 1)}
set{LS3540, count(EMA(35) > EMA(40), 1)}
set{LS3035, count(EMA(30) > EMA(35), 1)}
set{LS1, LS6070 + LS5060}
set{LS2, LS1 + LS4050}
set{LS3, LS2 + LS3540}
set{long_term_score, LS3 + LS3035}

draw long_term_score
draw short_term_score
set{comp_score, long_term_score + short_term_score}

add column separator
add column short_term_score
add column long_term_score
add column comp_score

/*compression/expansion*/
set{short_band01, EMA(3) - EMA(15)}
set{short_bandwidth, short_band01 / EMA(15)}
draw short_bandwidth
draw short_bandwidth line at 0
set{long_band01, EMA(30) - EMA(70)}
set{long_bandwidth, long_band01 / EMA(70)}
draw long_bandwidth on plot short_bandwidth
add column separator
add column short_bandwidth
add column long_bandWidth

/*FILTER for trend reversal*/
set{days_down, count(comp_score < 1, 15)}
add column days_down
sort on column 9 descending
comp_score > 0
long_term_score < 1
short_term_score < 3
short_term_score > short_term_score 1 day ago

/*FILTER for short term dip in trend*/
/*long_term_score > 4
short_term_score > 1
sort on column 6 ascending*/

/*entry point, trying to figure out how to code a count back line*/

draw rsi(14)
do not draw comp_score
]


graftonian
1,089 posts
msg #131299
Remove message
9/19/2016 11:32:18 AM

To see if I understand this system, your thoughts on CTLT with a close above 26.09 today.

Mactheriverrat
3,178 posts
msg #131322
Remove message
modified
9/20/2016 1:31:43 AM

I would say yes on CTLT
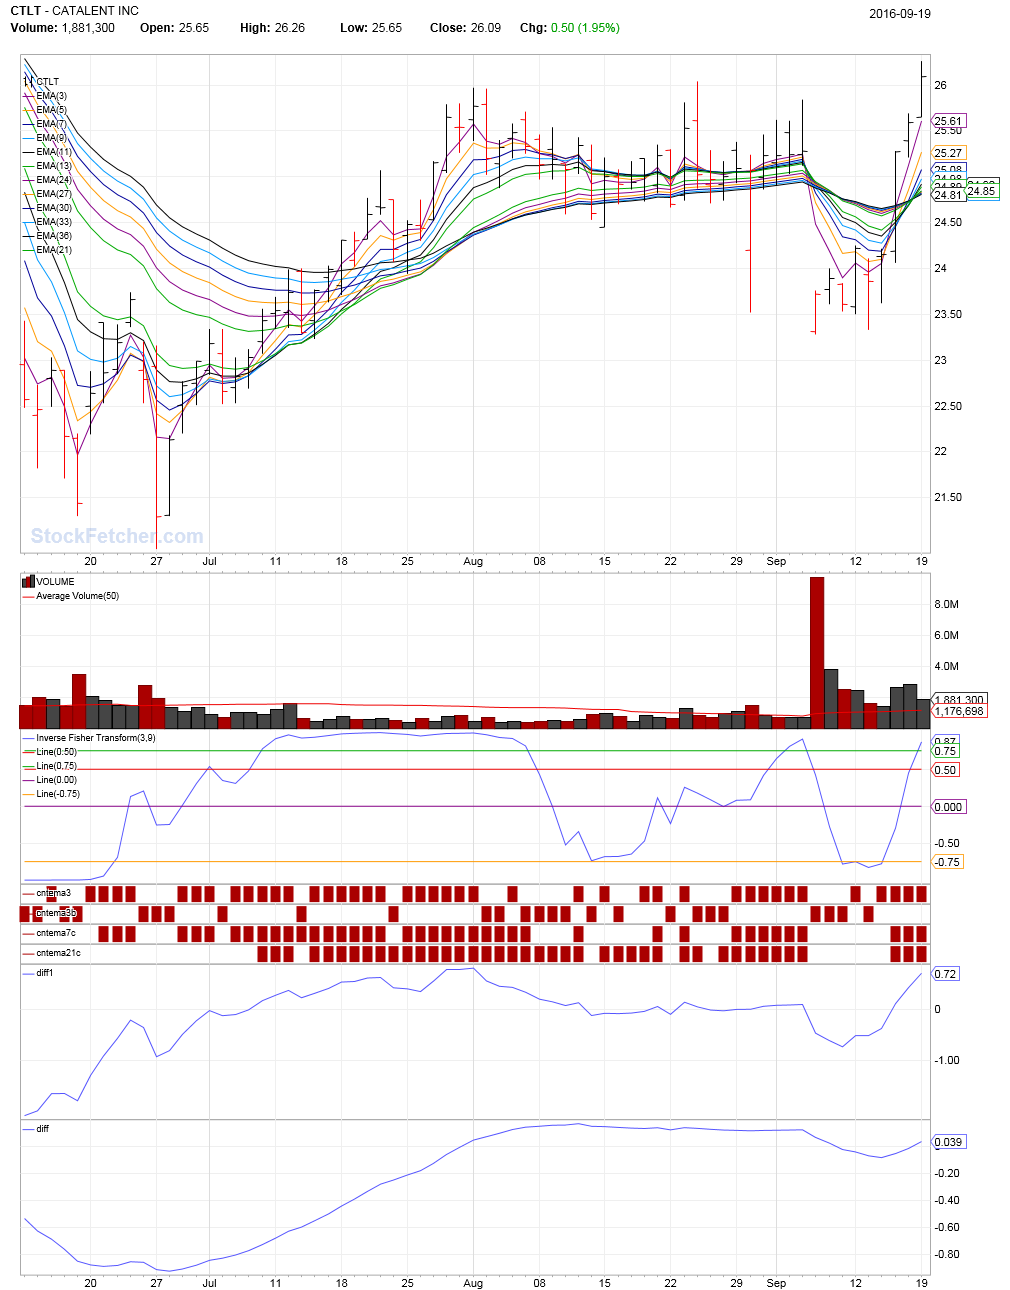

As for my CHK which I was just watching . It was a bad call as there was weakness in the short term group and flatness in the longer term group
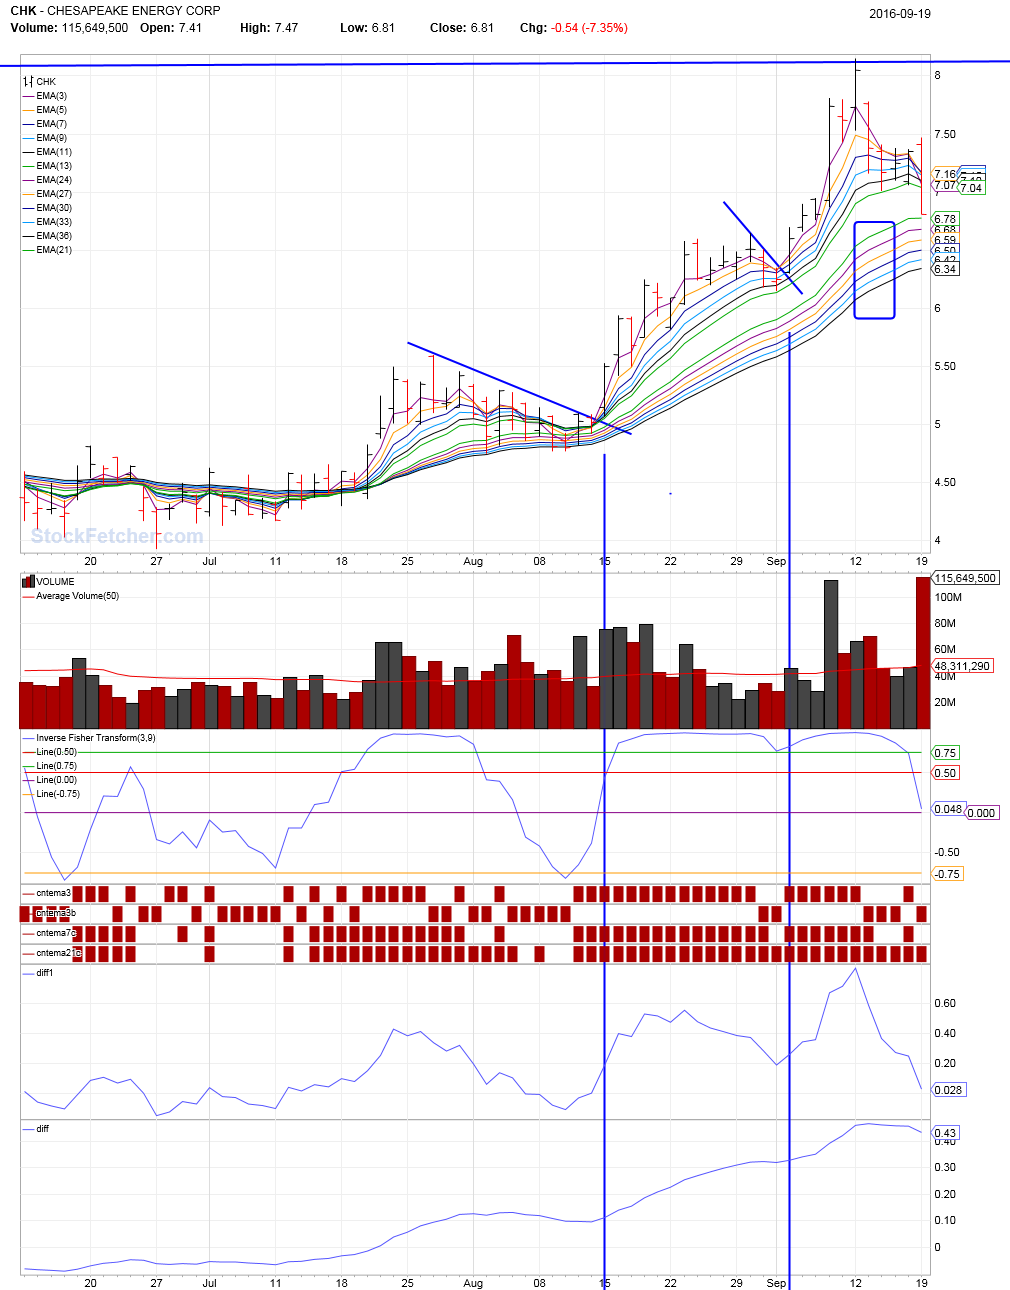


Here is the code for those bottom to lines
the diff is for ratio for the ema(3) vs the ema(13)
and diff1 is for the ratio EMA(13) vs EMA(36)


set{diff, EMA(3) - EMA(13)}
draw diff

set{diff1, EMA(21) - EMA(36)}
draw diff1


Mactheriverrat
3,178 posts
msg #131324
Remove message
9/20/2016 2:38:51 AM

I'm still playing with this filter!!!!!!!!!!!!!!!!!!!!!!!!!!!!!

StockFetcher Forums · Stock Picks and Trading · Using Guppy GMMA - Put AMBA on pullback watch list buy in today.<< 1 2 >>Post Follow-up

*** Disclaimer *** StockFetcher.com does not endorse or suggest any of the securities which are returned in any of the searches or filters. They are provided purely for informational and research purposes. StockFetcher.com does not recommend particular securities. StockFetcher.com, Vestyl Software, L.L.C. and involved content providers shall not be liable for any errors or delays in the content, or for any actions taken based on the content.


Copyright 2026 - Vestyl Software L.L.C.Terms of Service | License | Questions or comments? Contact Us
EOD Data sources: DDFPlus & CSI Data Quotes delayed during active market hours. Delay times are at least 15 mins for NASDAQ, 20 mins for NYSE and Amex. Delayed intraday data provided by DDFPlus


This site is protected by reCAPTCHA and the Google Privacy Policy and Terms of Service apply.