| StockFetcher Forums · Stock Picks and Trading · Using Guppy GMMA - Put AMBA on pullback watch list buy in today. | << 1 2 3 >>Post Follow-up |
| graftonian 1,089 posts msg #131258 - Ignore graftonian |
9/18/2016 1:22:36 PM Mac, Watched the video, plus another by Daryl Guppy. Alot of interesting ideas. I am working on 2 filters,one to measure how the long term and short term averages are "stacked", and the other to measure the compression and expansion of the two groups. Will post when I get them cleaned up. |
| graftonian 1,089 posts msg #131265 - Ignore graftonian |
9/18/2016 7:59:37 PM There are two filters in the following code, one for reversals in long term trend and another (commented out) for short dips in long trend. |
| graftonian 1,089 posts msg #131299 - Ignore graftonian |
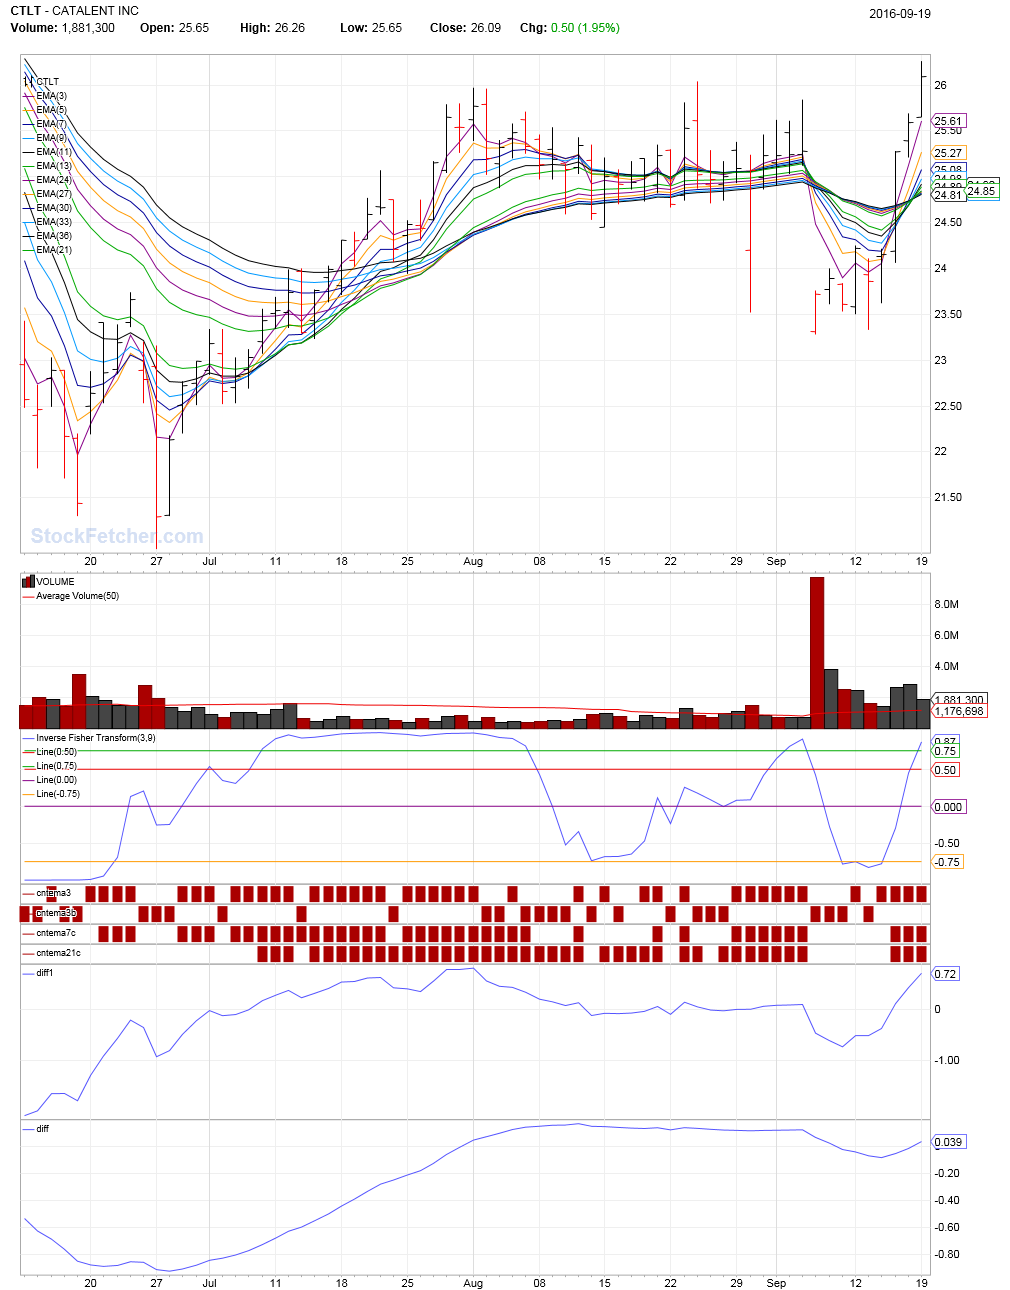
9/19/2016 11:32:18 AM To see if I understand this system, your thoughts on CTLT with a close above 26.09 today. |
| Mactheriverrat 3,178 posts msg #131322 - Ignore Mactheriverrat modified |
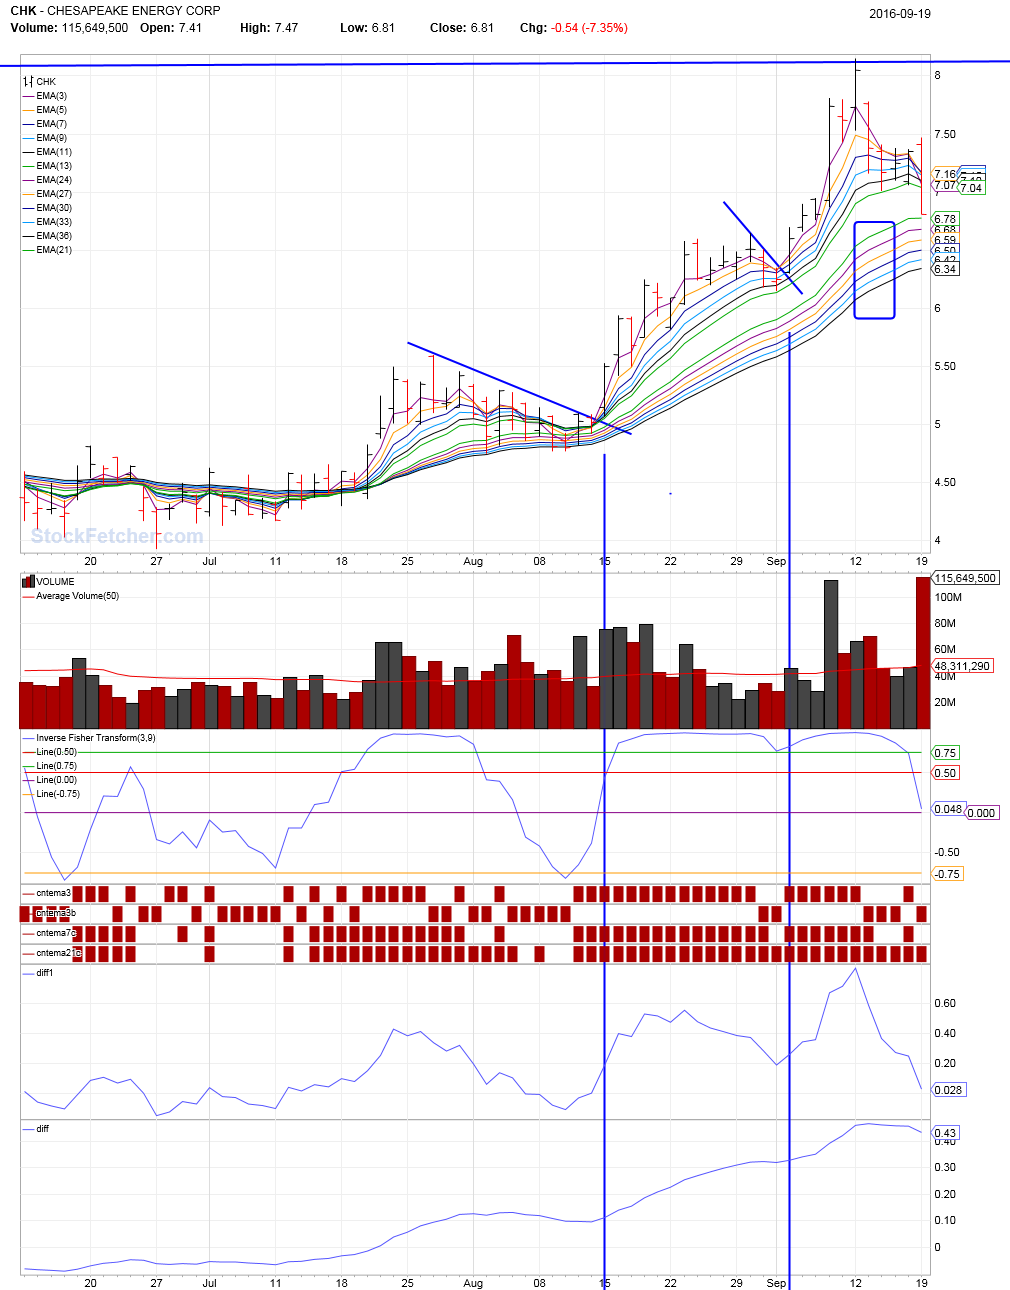
9/20/2016 1:31:43 AM I would say yes on CTLT  As for my CHK which I was just watching . It was a bad call as there was weakness in the short term group and flatness in the longer term group  Here is the code for those bottom to lines the diff is for ratio for the ema(3) vs the ema(13) and diff1 is for the ratio EMA(13) vs EMA(36) set{diff, EMA(3) - EMA(13)} draw diff set{diff1, EMA(21) - EMA(36)} draw diff1 |
| Mactheriverrat 3,178 posts msg #131324 - Ignore Mactheriverrat |
9/20/2016 2:38:51 AM I'm still playing with this filter!!!!!!!!!!!!!!!!!!!!!!!!!!!!! |
| graftonian 1,089 posts msg #131337 - Ignore graftonian |
9/20/2016 2:52:13 PM mac, looks like we're both working in the same direction. Those 2 lower lines of yours are the same as my term"bandwidth", except I divided the difference by the long term ema, to get a number that was more universal across a group of stocks. Todays pick for me would be CLNY, but looks like a DOJI, so would wait awhile tomorrow. |
| four 5,087 posts msg #136616 - Ignore four |
7/4/2017 12:25:11 PM |
| graftonian 1,089 posts msg #136621 - Ignore graftonian |
7/4/2017 4:07:24 PM Hey Ed, give me your best GUPPY analysis on ABWN. Thanx, Duane |
| pthomas215 1,251 posts msg #136624 - Ignore pthomas215 |
7/5/2017 10:48:11 AM Graftonian, so upset I didnt get in CALA today., that was the GUPPY play today. |
| nibor100 1,102 posts msg #136777 - Ignore nibor100 |
7/15/2017 5:07:58 PM @graftonian, I'm way behind in reading forum posts.... Regarding ABWN using Guppy charts on July 4th: On the positive side for going long the short term mov averages are stacked in order 3,5,8,10,12,15 and the 15 has recently crossed upward thru the 30 day which has done well in the past for ABWN. On the negative side, the 30 day is still below the 50 and 60 day long term avgs, they are still attached to the short term mov avgs therefore no open space between rising short term mov avgs and rising long term mov avgs (long term are kind of flat) The closeness of the long term mov avgs to each other could signify an near term move in either direction but probably up due to recent short term group activity. Regardinng ABWN using Guppy charts today: 15 has held above 30, barely, long term mov avgs have stayed flat and closely grouped short term mov avgs have collaped a bit negatively seems to me, like ABWN is undecided on which way to move. Ed S. |
| StockFetcher Forums · Stock Picks and Trading · Using Guppy GMMA - Put AMBA on pullback watch list buy in today. | << 1 2 3 >>Post Follow-up |