StockFetcher Forums · General Discussion · Sector ETFs in one indicator<< >>Post Follow-up
snappyfrog
721 posts
msg #161128
Ignore snappyfrog
6/8/2024 10:01:28 AM

Is there a way I can take the following sector ETFs, do some type of "count" if they are up or down
and combine them all into an oscillator with a zero line?

Basically, if 6 or more are up, the oscillator would be above 0 and if 6 or more are down it would be below 0.

Or is there a better way of figuring out a market depth indicator? I presently am using the McClellan with
a 5 day smoothing, which I love.

xlk,xlv,xlf,xlre,xle,xlb,xly,xli,xlu,xlp,xlc

McClellan Oscillator that I presently use:

Fetcher[
apply to symlist(spy)
set{vara,ind(^advn,close)}
set{vard,ind(^decn,close)}
set{var,vara - vard}
set{var1,cema(var,39)}
set{var2,cema(var,19)}
set{mcclellan,var2 - var1}
draw mcclellan line 0
draw cma(mcclellan,5)
do not draw mcclellan
draw rsi(10) line 40
draw rsi(10) line 60

add column separator
add column rsi(10)
add column rsi(10) 1 day ago
add column separator
add column mcclellan 10 day low
add column mcclellan
add column mcclellan 1 day ago
add column mcclellan 10 day high
add column separator
add column cma(Accumulation Distribution,2) {AD3}
add column cma(Accumulation Distribution,2) 1 day ago {AD3 1 day ago}
]


nibor100
1,031 posts
msg #161129
Ignore nibor100
6/8/2024 5:41:13 PM

I believe this gets you close to what you wanted....plus, once again, I learned a little more about SF, summing a limited column of variables from different stocks!

Ed S.

Fetcher[
apply to symlist(xlk,xlv,xlf,xlre,xle,xlb,xly,xli,xlu,xlp,xlc)
set{var1, count(roc(1) > 0,1)} add column var1

set{var1a, IND(xlk, var1)}
set{var1b, IND(xlf, var1)} set{var2, var1a + var1b}
set{var1c, IND(xlu, var1)}
set{var1d, IND(xli, var1)} set{var4, var1c + var1d}
set{var1e, IND(xlc, var1)}
set{var1f, IND(xlv, var1)} set{var6, var1e + var1f}

set{var1g, IND(xly, var1)}
set{var1h, IND(xlre, var1)} set{var8, var1g + var1h}
set{var1i, IND(xle, var1)}
set{var1j, IND(xlp, var1)} set{var10, var1i + var1j}
set{var1k, IND(xlb, var1)}

set{var3, var2 +var4}
set{var7, var6 +var8}
set{var11, var10 +var1k}

set{var5, var3 +var7}
set{Snappy, var5 +var11} add column Snappy

draw Snappy line 6
draw cma(Snappy,5)
draw Snappy
]


snappyfrog
721 posts
msg #161132
Ignore snappyfrog
6/8/2024 6:12:00 PM

Very nice Ed.

I remember another post you did sums that way. Very cool.

Thanks!

snappyfrog
721 posts
msg #161133
Ignore snappyfrog
modified
6/8/2024 6:31:21 PM

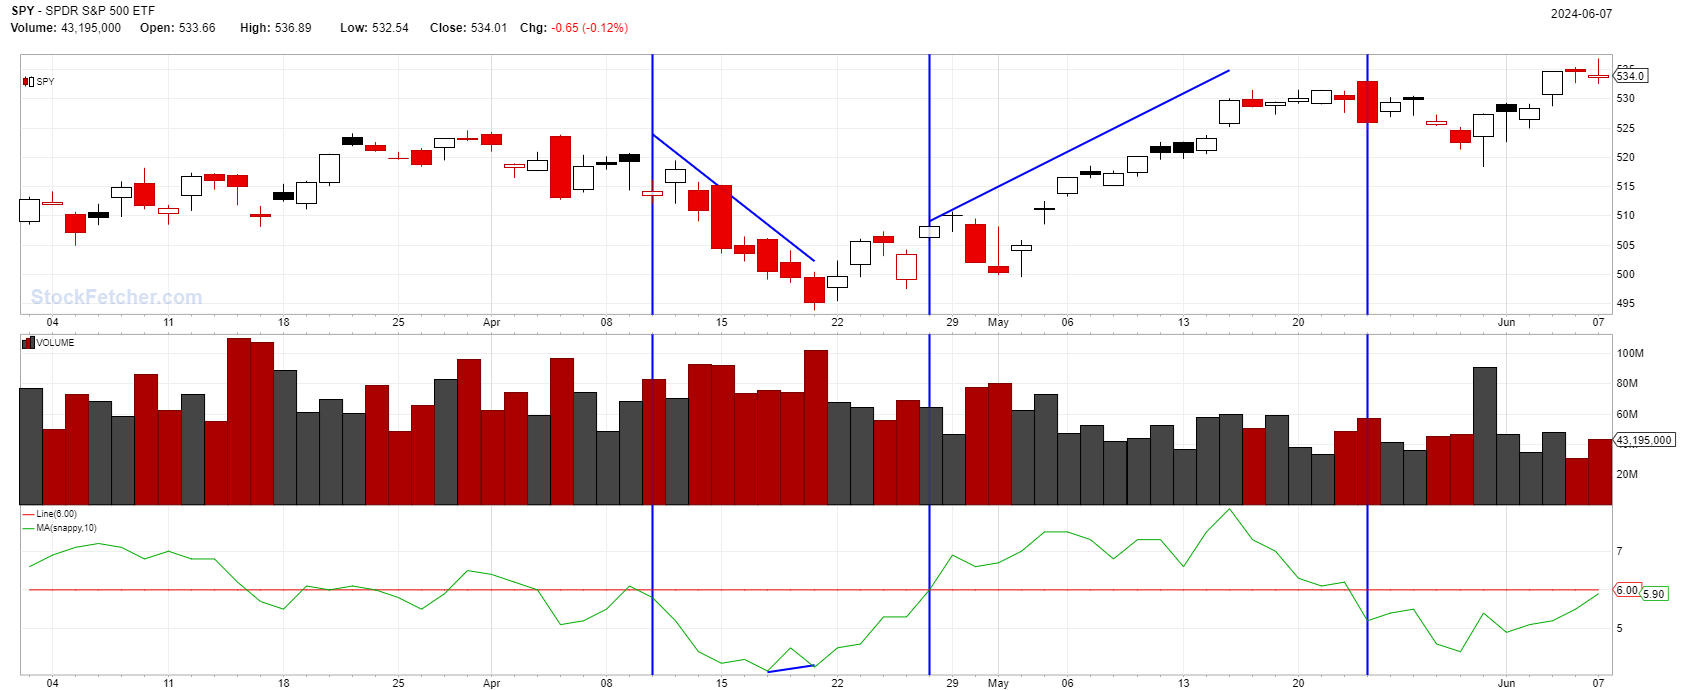
I have put it only on SPY so I can see the sum of all of the sectors against the overall market chart.

I also only kept the smoothed Snappy to reduce the noise and made it a slower cma(Snappy,10).

I think I am getting there. This chart shows when the Snappy,10 crossed below 6 with the corresponding move on Spy.

The next set of vertical lines shows when the sectors (Snappy,10) was 6 or above and the move on SPY.

I am hoping to see advanced weakness against the SPY chart as a warning when to be ready to bail on bullish moves (see the peak on Snappy,10 just left of the right hand vertical line).


Fetcher[
apply to symlist(spy)
set{var1, count(roc(1) > 0,1)} add column var1

set{var1a, IND(xlk, var1)}
set{var1b, IND(xlf, var1)} set{var2, var1a + var1b}
set{var1c, IND(xlu, var1)}
set{var1d, IND(xli, var1)} set{var4, var1c + var1d}
set{var1e, IND(xlc, var1)}
set{var1f, IND(xlv, var1)} set{var6, var1e + var1f}

set{var1g, IND(xly, var1)}
set{var1h, IND(xlre, var1)} set{var8, var1g + var1h}
set{var1i, IND(xle, var1)}
set{var1j, IND(xlp, var1)} set{var10, var1i + var1j}
set{var1k, IND(xlb, var1)}

set{var3, var2 +var4}
set{var7, var6 +var8}
set{var11, var10 +var1k}

set{var5, var3 +var7}
set{Snappy, var5 +var11} add column Snappy

draw Snappy line 6
draw cma(Snappy,10)
do not draw Snappy
]


If you have a basic subscription, you may have to click the Fetch button twice.

snappyfrog
721 posts
msg #161136
Ignore snappyfrog
6/9/2024 6:35:42 AM

After playing with the settings, I think I like Snappy(5) best. It seems to be a good balance between noise and a more accurate picture of what the relationship is between the sectors and overall market.

Basic subscribers may have to hit Fetch twice to see the chart.

Fetcher[
apply to symlist(spy)
set{var1, count(roc(1) > 0,1)} add column var1

set{var1a, IND(xlk, var1)}
set{var1b, IND(xlf, var1)} set{var2, var1a + var1b}
set{var1c, IND(xlu, var1)}
set{var1d, IND(xli, var1)} set{var4, var1c + var1d}
set{var1e, IND(xlc, var1)}
set{var1f, IND(xlv, var1)} set{var6, var1e + var1f}

set{var1g, IND(xly, var1)}
set{var1h, IND(xlre, var1)} set{var8, var1g + var1h}
set{var1i, IND(xle, var1)}
set{var1j, IND(xlp, var1)} set{var10, var1i + var1j}
set{var1k, IND(xlb, var1)}

set{var3, var2 +var4}
set{var7, var6 +var8}
set{var11, var10 +var1k}

set{var5, var3 +var7}
set{Snappy, var5 +var11} add column Snappy

draw Snappy line 6
draw cma(Snappy,5)
do not draw Snappy
]


styliten
295 posts
msg #161137
Ignore styliten
6/9/2024 10:21:35 AM

Wow, that’s a very clever use of IND combined with a custom function.

Now it seems possible to track the largest 25 tickers of the US stock market, approximately 36% of the entire market cap is in these 25 tickers!

(The next 25 tickers has 8.6% of the stock market and the next 25 tickers some 6%. So literally these 75 tickers [out of ? 6000+ total] are half of the entire US stock market in terms of market cap. The largest companies are getting ever bigger share of the pie daily squeezing out everyone else.)

nibor100
1,031 posts
msg #161138
Ignore nibor100
6/9/2024 10:57:55 AM

@styliten,

Does that mean you were able to sum 25 symbols IND()s without the filter not executing due to complexity issues?

thanks,
Ed S.

snappyfrog
721 posts
msg #161149
Ignore snappyfrog
6/14/2024 10:45:14 PM

Looking back 2 years using the Snappy,5 and Snappy,10, I have determined that there is nothing for me to see in this as a market breadth indicator.

StockFetcher Forums · General Discussion · Sector ETFs in one indicator<< >>Post Follow-up

*** Disclaimer *** StockFetcher.com does not endorse or suggest any of the securities which are returned in any of the searches or filters. They are provided purely for informational and research purposes. StockFetcher.com does not recommend particular securities. StockFetcher.com, Vestyl Software, L.L.C. and involved content providers shall not be liable for any errors or delays in the content, or for any actions taken based on the content.


Copyright 2022 - Vestyl Software L.L.C.Terms of Service | License | Questions or comments? Contact Us
EOD Data sources: DDFPlus & CSI Data Quotes delayed during active market hours. Delay times are at least 15 mins for NASDAQ, 20 mins for NYSE and Amex. Delayed intraday data provided by DDFPlus


This site is protected by reCAPTCHA and the Google Privacy Policy and Terms of Service apply.