| StockFetcher Forums · General Discussion · QUUUESTIOn | << >>Post Follow-up |
| trosen128 8 posts msg #112882 - Ignore trosen128 |
4/21/2013 1:02:33 PM how do I make it so that I get stocks that are in the green one day even though I have data offset for 1 day? Thanks |
| four 5,087 posts msg #112883 - Ignore four |
4/21/2013 1:55:55 PM |
| Mactheriverrat 3,178 posts msg #112887 - Ignore Mactheriverrat |
4/21/2013 11:15:56 PM Hey Four Can you add the following below the line to that filter. Then do a backtest. I always look at the CxC 1 first , where's the resistance(65,10), What's the stochrsi(14), stochastic %k (5,3,3) and the Macd Hist doing, Look at the stocks the day before as to some of the trend changes ---------------------------------------------------------------------------------------------- show stocks where high is less than 10% below resistance(65,10) and resistance(65,10) is above 0 and stochrsi(14) is above 0.66 amd CMF(4) is above CMF(4) one day ago and CMF(4) is above CMF(4) two day ago volume is above 140000 average volume is above 140000 Draw average and sort column 7 descending Draw stochastic %k(5,5,3) draw macd histogram(12,26,9) draw resistance(25,12,2) draw resistance(45,15,2) draw resistance(65,10) CxC is number of consecutive days close above (+)/below(-) previous close and set{CCb,days(close is above close 1 day ago,100)} set{CCa,days(close is below close 1 day ago,100)} set{CxC, CCa - CCb} and add column CxC {C_x_C} do not draw CxC chart-time is 80 days |
| four 5,087 posts msg #112921 - Ignore four modified |
4/23/2013 7:35:57 PM I don't back test, electronically.... Perhaps, someone will be kind enough to fill that part of your request. |
| Mactheriverrat 3,178 posts msg #112924 - Ignore Mactheriverrat |
4/23/2013 10:04:53 PM Stats Equity Summary Name Start End Win(%) Lose(%) Reward/Risk ROI(%) Market Value Account Value Realized G/L(%) close 1 day ago > open 1 day ago 11/29/2012 2/15/2013 73.8 26.0 2.80 59.9 94,278 96,914 -1.9 -------------------- Not bad I would say! I'm not up to speed on the whole backtesting thing |
| Mactheriverrat 3,178 posts msg #112925 - Ignore Mactheriverrat modified |
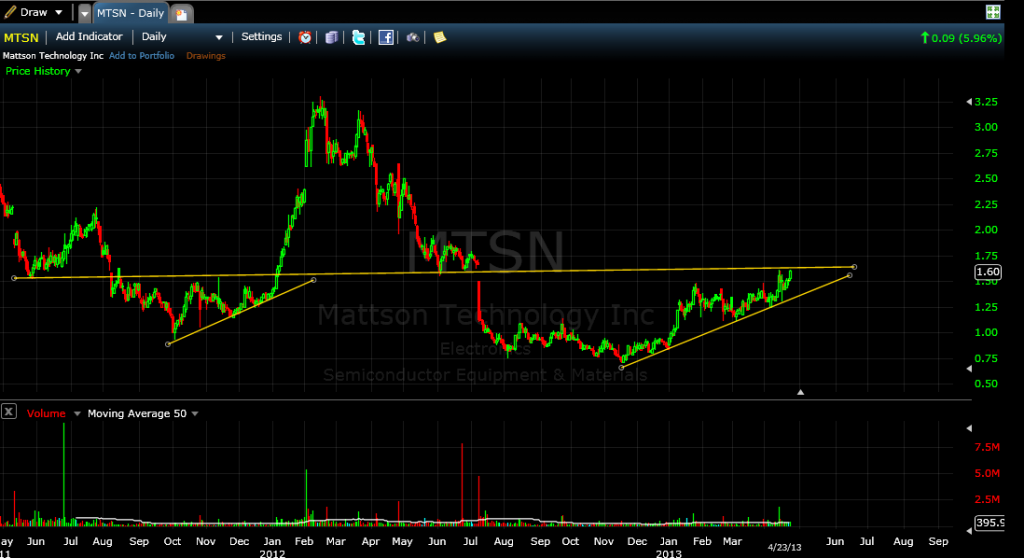
4/23/2013 10:54:59 PM But what do we really see here. We all know there is no such thing as a Holy Grail filter. Looking at a one year chart I see MTSN which I have been watching already. From about tje first of the year on every MTSN gets a 2 to 4 day run up towards the resistance line at about 1.62 or somewhere there about volume spikes pick up then bears take it back down . Now were right below the 1.62 resistance line . Guess we will find out were it goes in the next couple of days  |
| Mactheriverrat 3,178 posts msg #112926 - Ignore Mactheriverrat |
4/24/2013 3:15:05 AM As they report earning after the market close's . I don't play earnings. I expect MSTN to doji candle tomorrow the see what happens after the bell. |
| StockFetcher Forums · General Discussion · QUUUESTIOn | << >>Post Follow-up |