| StockFetcher Forums · General Discussion · Justification of short term trading | << 1 2 >>Post Follow-up |
| dknoonan 27 posts msg #113019 - Ignore dknoonan |
4/28/2013 4:57:05 PM I've enjoying doing a little short-term trading, but I have an ethics question: does it have a beneficial role to play ? I think a free market is good. I also think long-term investors in the stock market help supply companies with capital to grow. What about short -term trading? Does it serve a purpose -- perhaps to make for an efficient market? I've often heard that we are just people taking money from each other, but I wonder if there is more to it than that. |
| four 5,087 posts msg #113021 - Ignore four modified |
4/28/2013 5:14:45 PM http://papers.ssrn.com/sol3/papers.cfm?abstract_id=2236201# What Do We Know About High-Frequency Trading? Charles M. Jones Columbia Business School - Finance and Economics March 20, 2013 Columbia Business School Research Paper No. 13-11 Abstract: This paper reviews recent theoretical and empirical research on high-frequency trading (HFT). Economic theory identifies several ways that HFT could affect liquidity. The main positive is that HFT can intermediate trades at lower cost. However, HFT speed could disadvantage other investors, and the resulting adverse selection could reduce market quality. Over the past decade, HFT has increased sharply, and liquidity has steadily improved. But correlation is not necessarily causation. Empirically, the challenge is to measure the incremental effect of HFT beyond other changes in equity markets. The best papers for this purpose isolate market structure changes that facilitate HFT. Virtually every time a market structure change results in more HFT, liquidity and market quality have improved because liquidity suppliers are better able to adjust their quotes in response to new information. Does HFT make markets more fragile? In the May 6, 2010 Flash Crash, for example, HFT initially stabilized prices but were eventually overwhelmed, and in liquidating their positions, HFT exacerbated the downturn. This appears to be a generic feature of equity markets: similar events have occurred in manual markets, even with affirmative market-maker obligations. Well-crafted individual stock price limits and trading halts have been introduced since. Similarly, kill switches are a sensible response to the Knight trading episode. Many of the regulatory issues associated with HFT are the same issues that arose in more manual markets. Now regulators in the US are appropriately relying on competition to minimize abuses. Other regulation is appropriate if there are market failures. For instance, consolidated order-level audit trails are key to robust enforcement. If excessive messages impose negative externalities on others, fees are appropriate. But a message tax may act like a transaction tax, reducing share prices, increasing volatility, and worsening liquidity. Minimum order exposure times would also severely discourage liquidity provision. |
| Mactheriverrat 3,178 posts msg #113035 - Ignore Mactheriverrat |
4/29/2013 2:30:27 PM Sym Qty Entry Last Chg Value Gain $ % ! EGLE 277 3.24 3.43 0.19 950.11 52.63 5.9% Sym Qty Entry Last Chg Value Gain $ % ! JASO 623 4.81 5.19 0.38 3,233.37 236.74 7.9% LEDS 1,862 1.60 1.99 0.23 3,705.38 726.18 24.4% SPWR 224 13.25 13.93 0.68 3,120.32 152.32 5.1% SELL 52.63= EGLE 1st day trade up 5.9% / Leg up heading towards a Ascending Triangle breakoutt . 236.74=JASO 1st day trade up 7.9% / Ascending Triangle breakout 726.18=LEDS 2nd dat trade up 24.9% /Ascending Triangle breakout 152.32= SPWR 1st day trade up 5.1% / Ascending Triangle breakout ---------- $1167.87 profit if I sold right now. Some of the best profits come from Ascending Triangle breakouts = Justification of short term trading! |
| Mactheriverrat 3,178 posts msg #113036 - Ignore Mactheriverrat modified |
4/29/2013 3:54:54 PM I missed getting into MITK - CRAP! Now that was a good Ascending Triangle breakout! Up 10% late time I checked! Like Dad said " Too late smart we get". Sold LEDS 38% Profit 04/26/13 Buy LEDS 1,862 1.6000 2,989.15 4/29/13 Sell LEDS 1,862 2.2100 4,115.02 Profit $1,115.92 up 37% |
| miketranz 978 posts msg #113039 - Ignore miketranz |
4/29/2013 10:10:45 PM Show stocks where the count(high reached new 365 day high, 30) is above 3 and pattern is ascending triangle and close is near 365 day high Enjoy........ |
| boston 58 posts msg #113048 - Ignore boston |
4/30/2013 11:12:12 AM |
| Mactheriverrat 3,178 posts msg #113049 - Ignore Mactheriverrat modified |
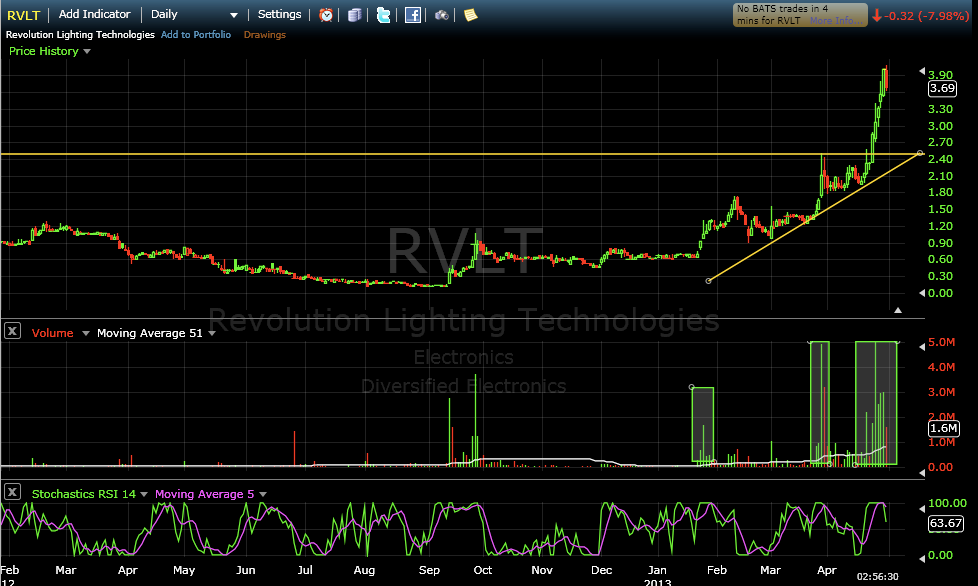
4/30/2013 2:17:40 PM I've had better luck with this below and looking for stocks that are getting to previous resistance levels. Looking also at when the price went up previous levels for above average volume clusters . Look at RVLT as a example. Look at the volume as it show where its above average volume , If its jump before with buyers jumping on above average they will jump in again as the stock nears the resistance line - Jump on the band wagon! ----------------------------------------------------------------------- Show stocks were the price change is above 1% volume is above average volume set{ratio, volume /average volume } and add column ratio Draw Average Volume and volume is above 300000 draw symlist( rvlt) draw resistance(25,12,2) draw resistance(45,15,2) draw resistance(65,10) ----------------------------------------------------------------------- Here's another show stocks where high is less than 7.25% below resistance(65,10) ----------------------------------------------------------------------- and another show stocks where high is less than 7.25% below resistance(65,10) and resistance(65,10) is above 0 |
| Mactheriverrat 3,178 posts msg #113050 - Ignore Mactheriverrat |
4/30/2013 3:00:17 PM |
| Mactheriverrat 3,178 posts msg #113051 - Ignore Mactheriverrat |
4/30/2013 3:04:26 PM I'm all cash today - nothing looks good to me today |
| duke56468 683 posts msg #113052 - Ignore duke56468 |
4/30/2013 4:20:26 PM |
| StockFetcher Forums · General Discussion · Justification of short term trading | << 1 2 >>Post Follow-up |