| StockFetcher Forums · General Discussion · Different strategy(chart inside): Long term charts, big % gains. | << 1 2 3 >>Post Follow-up |
| nanayeki 6 posts msg #51093 - Ignore nanayeki modified |
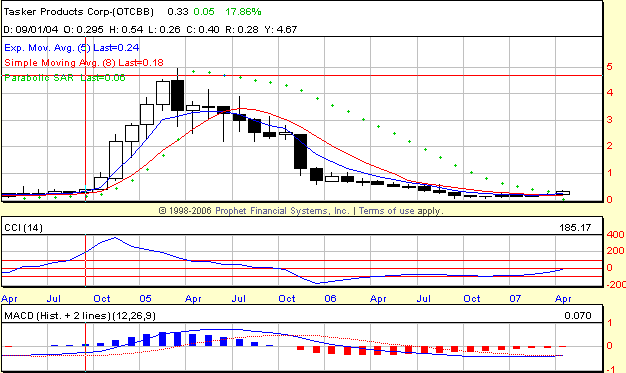
4/14/2007 4:16:01 PM Hi, ( Note: SF staff, don't delete this message, because it is related to SF. This is an example to see the importance of monthly data, I found this stock using my own filter written by myself using java language, if SF can provide monthly data, I don't have to mannually filter the monthly data very week, it takes about 1 hour to do that from downloading data from yahoo server to getting the filtered stock symbols, thanks!) I think I am a different type of trader. When I need to determine which stocks to buy, I use weekly and monthly charts and indicators; when I find out it is "time" to buy, I use daily and hourly chart to get a relative low entry point, and then all I need to do is to watch, watch the changes made on weekly and monthly charts (indicators) as time goes by, I wait until the weekly chart give a sell signal then I will sell my position. So basically I am a position trader who buy stocks only when the long term charts say there is a major trend to begin. This way one doesn't need many trade to make serious money. I bought a stock called TKER a few days ago after I studied the weekly and monthly charts. I AM NOT GOING TO DO ANY PREDICTION ON MY TARGET PRICE, I POST THE CHART SO THAT EVERYBODY CAN SEE IT AND UNDERSTAND MY TRADING STRATEDY, I WILL POST ANOTHER CHART IN A FEW MONTHS TO SEE WHERE THE STOCK PRICE IS. Last time when MACD crossed above the signal line and PPS crossed above parabolic SAR in May 2004, the PPS went from 25 cents to $5 in a few months, that's 2000%, you only need a few trade like this to become a millionare. I think the history will repeat itself on TKER. 
I don't expect many people believe me if I say I have 8.3x more money than I had last year. So wait until I post second chart on TKER a few months later in 2007. good trading! |
| judgetrade 107 posts msg #51130 - Ignore judgetrade |
4/15/2007 3:47:19 PM OK, I give it a try with 1% of my bankroll. 8.3 Times, wow, what are your methods? Monthly Charts? What Signals? Thank you! |
| jrbikes 624 posts msg #51155 - Ignore jrbikes |
4/16/2007 1:22:32 PM Im in! I love penny stocks, if Im wrong I dont loose my shirt, just my sleeve! |
| judgetrade 107 posts msg #51156 - Ignore judgetrade |
4/16/2007 1:46:45 PM + 8.57%, nice, will hold for some weeks, but it starts nice! |
| jrbikes 624 posts msg #51178 - Ignore jrbikes |
4/17/2007 1:28:37 PM SLGLF CPST VRA exhibiting same pattern? |
| jrbikes 624 posts msg #51179 - Ignore jrbikes |
4/17/2007 1:34:07 PM The daily, weekly, and monthly charts all exhibit the same characteristics, that is they kinda look the same as each other, the signals are based on monthly charts and not daily charts, if you trade by the monthly chart you would enter and exit based on monthly criteria, thats what it seems like to me, but I could be wrong! big charts has a chart that is pretty cool, the interactive chart will resemble this pattern on TKER and you can see the monthly point of entry, I like for the 9 18 27 to be lined up for the entry, it seems a little safer! its kinda like a momentum play! |
| jchill2000 2 posts msg #51581 - Ignore jchill2000 |
5/14/2007 2:13:04 PM I use metastock for looking at monthly and weekly data. With stockfetcher you can use weekly indicators. Obviously it does not support monthly indicators. However, you can mimic, somewhat, a monthly indicator by increasing the magnitude of the parameters in the weekly MACD function. You will not get an exact match but it may be a way of establishing a watch list for studies using BigCharts, metastock, etc. The advantage of stockfetcher is its large database. With metastock I have to download the data and frankly I am not going to download a large set of stock symbols. JH |
| guru_trader 485 posts msg #51592 - Ignore guru_trader |
5/14/2007 8:17:05 PM Which software and/or websites allow us to overlay minutely, hourly, daily, weekly, monthly, quarterly, yearly indicators on the same chart? |
| alf44 2,025 posts msg #51682 - Ignore alf44 |
5/18/2007 10:46:04 AM nanayeki, Here's a dumb question for ya...OR, for anyone for that matter... How did you post that Prophet Chart into a StockFetcher post ? I see that you have it hosted at Photobucket...but, how did you get it to display HERE in a SF post ? tia Regards, alf44 |
| nikoschopen 2,824 posts msg #51686 - Ignore nikoschopen |
5/18/2007 6:52:38 PM |
| StockFetcher Forums · General Discussion · Different strategy(chart inside): Long term charts, big % gains. | << 1 2 3 >>Post Follow-up |
