| StockFetcher Forums · Stock Picks and Trading · Generic | << 1 ... 10 11 12 13 14 ... 63 >>Post Follow-up |
| four 5,087 posts msg #122161 - Ignore four modified |
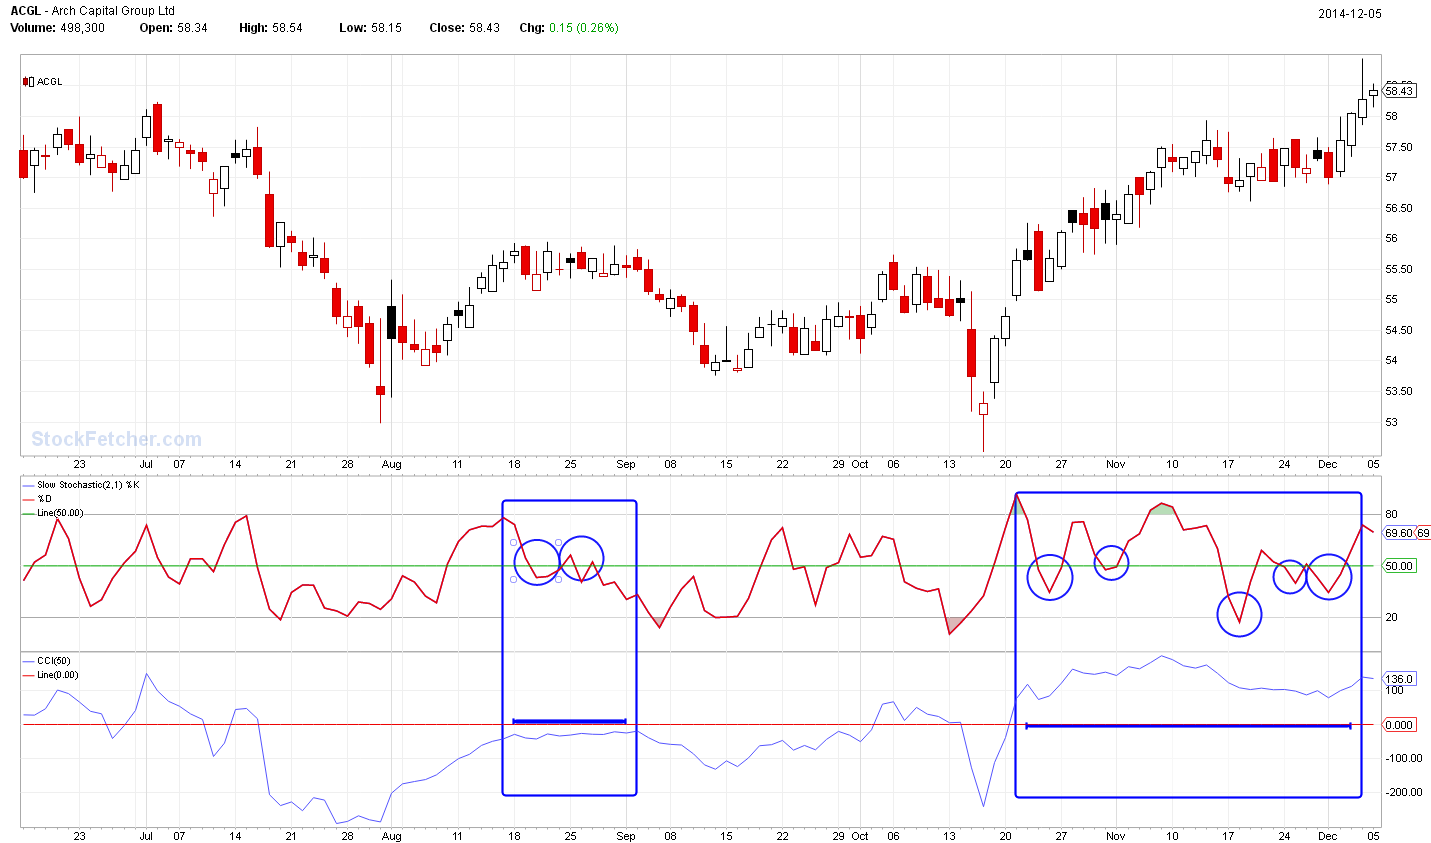
12/6/2014 11:02:02 AM watch stoch cross above 50 AND cci cross above 25 watch stoch cross below 50 AND cci cross below -25 |
| four 5,087 posts msg #122162 - Ignore four |
12/6/2014 2:31:55 PM |
| four 5,087 posts msg #122237 - Ignore four |
12/13/2014 7:28:40 PM http://www.tradingsetupsreview.com/profitable-losing-money/ Galen Woods |
| four 5,087 posts msg #122320 - Ignore four |
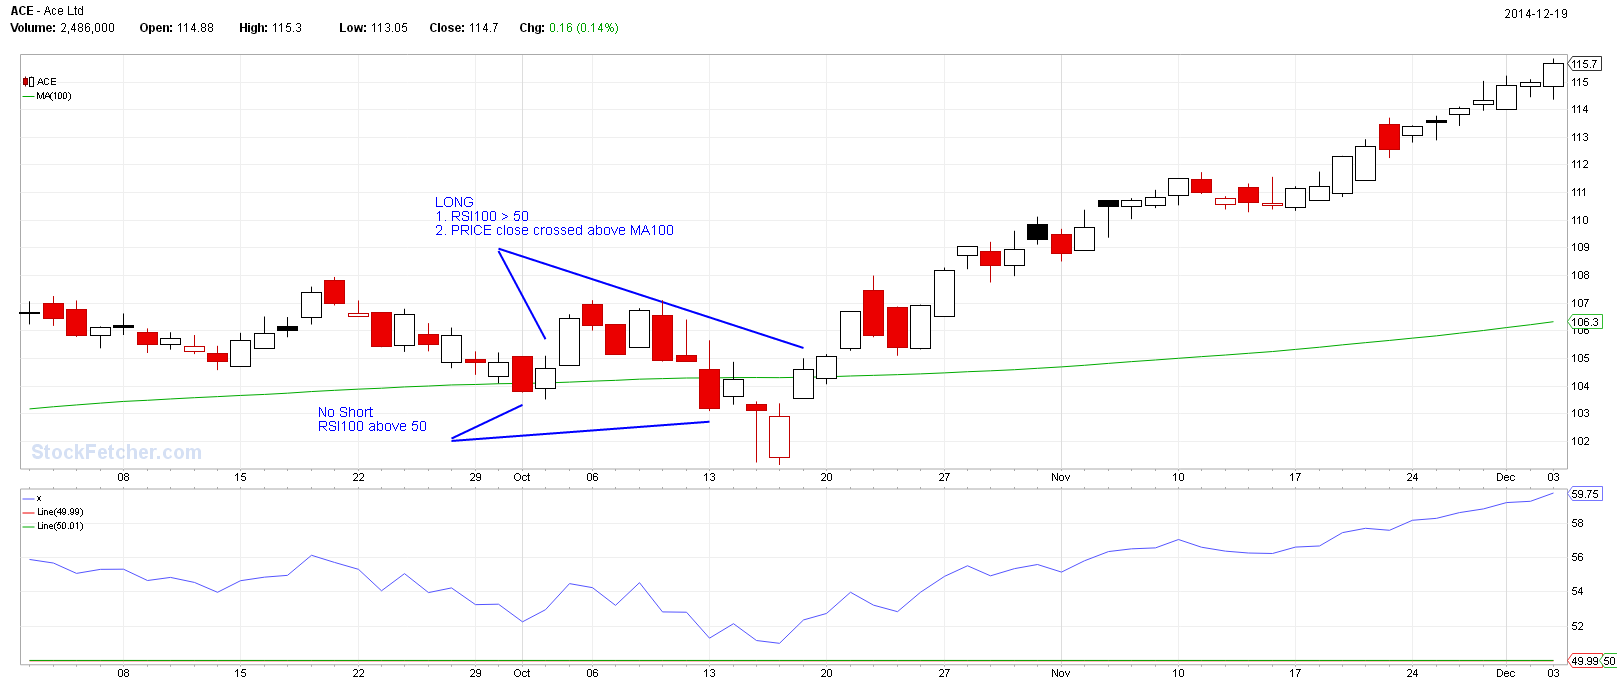
12/19/2014 11:59:02 PM |
| four 5,087 posts msg #122324 - Ignore four modified |
12/20/2014 11:15:02 AM http://www.daytradingzones.com/UserFiles/File/DayTradingZones_com%20-%20Pro-Trading%20-%20Revelations%20of%20a%20Trading%20Veteran.pdf http://traderkingdom.com/trading-futures-education-topics/trading-futures-basics/3188-how-position-size-and-allocate-capital https://drive.google.com/viewerng/viewer?url=http://www.daytradingzones.com/UserFiles/File/DayTradingZones_com%2520-%2520Pro-Trading%2520-%2520Revelations%2520of%2520a%2520Trading%2520Veteran.pdf Marc Nicolas |
| four 5,087 posts msg #122361 - Ignore four |
12/24/2014 12:43:47 PM http://www.trading-naked.com/Articles_and_Reprints.htm Articles and reprints |
| four 5,087 posts msg #122364 - Ignore four modified |
12/24/2014 4:37:43 PM http://tfl365.com/day-17/ loss versus win excel spreadsheet Calculation is incorrect at a point |
| four 5,087 posts msg #122381 - Ignore four |
12/28/2014 12:48:47 PM |
| four 5,087 posts msg #122437 - Ignore four |
12/31/2014 9:29:32 PM http://martinkronicle.com/volatility-study/ |
| four 5,087 posts msg #122471 - Ignore four modified |
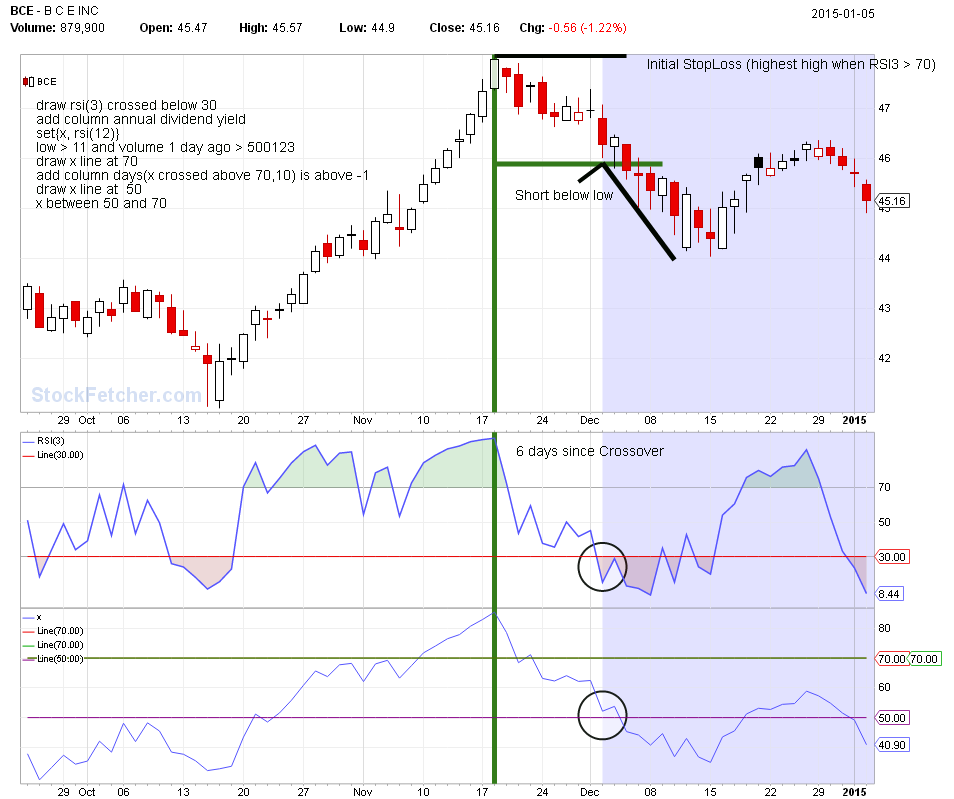
1/5/2015 11:48:59 PM Use highest high when RSI3 > 70 as initial StopLoss (refer to column: Days Since to count back) -- Perhaps: Swing High? Short = below low price of the current day (StopLimit)  |
| StockFetcher Forums · Stock Picks and Trading · Generic | << 1 ... 10 11 12 13 14 ... 63 >>Post Follow-up |