| StockFetcher Forums · Filter Exchange · Best of Four | << 1 2 >>Post Follow-up |
| aferguson3 9 posts msg #114024 - Ignore aferguson3 |
6/10/2013 3:54:12 PM fisher transform(5) and williams %R(90) Small Candle Sits Above MA(20) "The Best Short 1" "The Best Short 2: Quilln" Not sure the name Weekly RSI(2) Trading ^SPX closing prices Average crosses that happen above another average in the last week- HELP? how do I make it so that I get stocks that are in the green one day even though I have data offset for 1 day? Thanks Not enough mechanical system experience Deeply oversold mean-reverting setup for day trading How to filter for newer issues with less data base history PBF Energy Dow 30 struggling with creating custom indi Volume is two times greater than average volume set{x, 2 * average volume(50)} volume >= x add column x Question: Creating a index filter Indexes MACD - StockFetcher plot compared to Yahoo Finance smooth rsi2 and cci5 macd(8,9,1) and cci(21) Williams %R(5) and Bollinger %B(7,1) Simple Q: How to create an individual symbol as a filter (not used as a comparison) particular statistics of closing green or red Ultimate Oscillator Filter? Suppress 'x' and 'xx' Intraday Alerts MACD Query help Percent below MA for x number of days ma and ema and williams Williams and CCI and RSI how to sort my filter results can get you sorting on column 3 or 4 (Vol). Chg(%) is the third column... --- Use: sort column 3 descending --- Use: DESCENDING or ASCENDING 90 percent success with this filter filter for morning star and evening star MACD DIVERGENCE filter---help please GRAVESTONE AND DRAGONFLY DOJI Bullish Dragonfly Doji • Pattern is strongest after an established bearish trend • A candle forms with a very small to almost nonexistent body with a long lower wick • The lower wick is at least twice as long as the candlestick body • Little or no upper wick GRAVESTONE DOJI A type of candlestick pattern that is formed when the opening and closing price of the underlying asset are equal and occur at the low of the day. Index versus index components The following indices are available on StockFetcher.: http://help.stockfetcher.com/sfhelp/?id=100229 Example: ^INDU = DOW JONES INDUSTRIAL DMA Doji DT Oscillator Help modified volume, price range and rsi to get results... manually roll these values back toward your original values... to get what you want Really Clean and Clear Charts! Short Ideas Catch the rsi(2) corner (or a little early) RSI Screen not picking stocks over a threshold close above 10 Versus "over 10" identify Doji like pattern near the 8EMA 1. price between 5 - 150 close between 5 and 150 2. volume above 250,000 volume above 250,000 3. today's candle is a Doji Candlestick , and price is below 8EMA for last 5 days close equals open count(close < ema(8),5) equals 5 use rsi(2) and scalp 25 cents Version 2: Requires a minimum of 3 days @ rsi2 < 20 Question on Weekly Filters 5 day combo |
| aferguson3 9 posts msg #114025 - Ignore aferguson3 |
6/10/2013 3:58:16 PM arna and kcg perhaps a start here... Angle of a Moving Average using SLOPE... rsi(2) - rsi(3) Short Ideas Long Legged Doji Scan Playing with atr and stochastic ma and rsi for sp500 comparison plot the ma(5) of spy on the main chart panel --- log : rsi and cci Can I filter by industry indexes? create a symlist() of the indices [using etf]. List: http://etf.stock-encyclopedia.com/category/by-industry.html Materials = XLB Semiconductors = SMH Example: My 666 Filter FYI... Default: Average Volume(90) is being used clickable ma and rsi for sp500 comparison RSI(9) < -100 AND CCI(9) > 45 DT Oscillator Help Leveraged ETF Filter help |
| aferguson3 9 posts msg #114026 - Ignore aferguson3 |
6/10/2013 3:59:05 PM I don't have time to do all of them or organize it. But The above is up to page 25 of Four's posts if anyone wants to continue |
| Cheese 1,374 posts msg #114028 - Ignore Cheese |
6/10/2013 5:30:31 PM Wow. Thank you so much ! |
| Cheese 1,374 posts msg #114029 - Ignore Cheese |
6/10/2013 5:36:30 PM http://www.stockfetcher.com/forums/General-Discussion/DMA/95480&isiframe= According to Four: buy? 1. price below DMA - and - 2. DMA above MA |
| Cheese 1,374 posts msg #147528 - Ignore Cheese modified |
4/25/2019 11:26:48 AM Pop to the top Thanks, again aferguson3 Maybe, as a fan appreciation gesture, Four could give this thread a shortlist update of his/her current best. |
| four 5,087 posts msg #147557 - Ignore four modified |
4/25/2019 10:44:09 PM This has worked a few times... lately Remember the market action has been favorable for this type of filter... dips have become rips 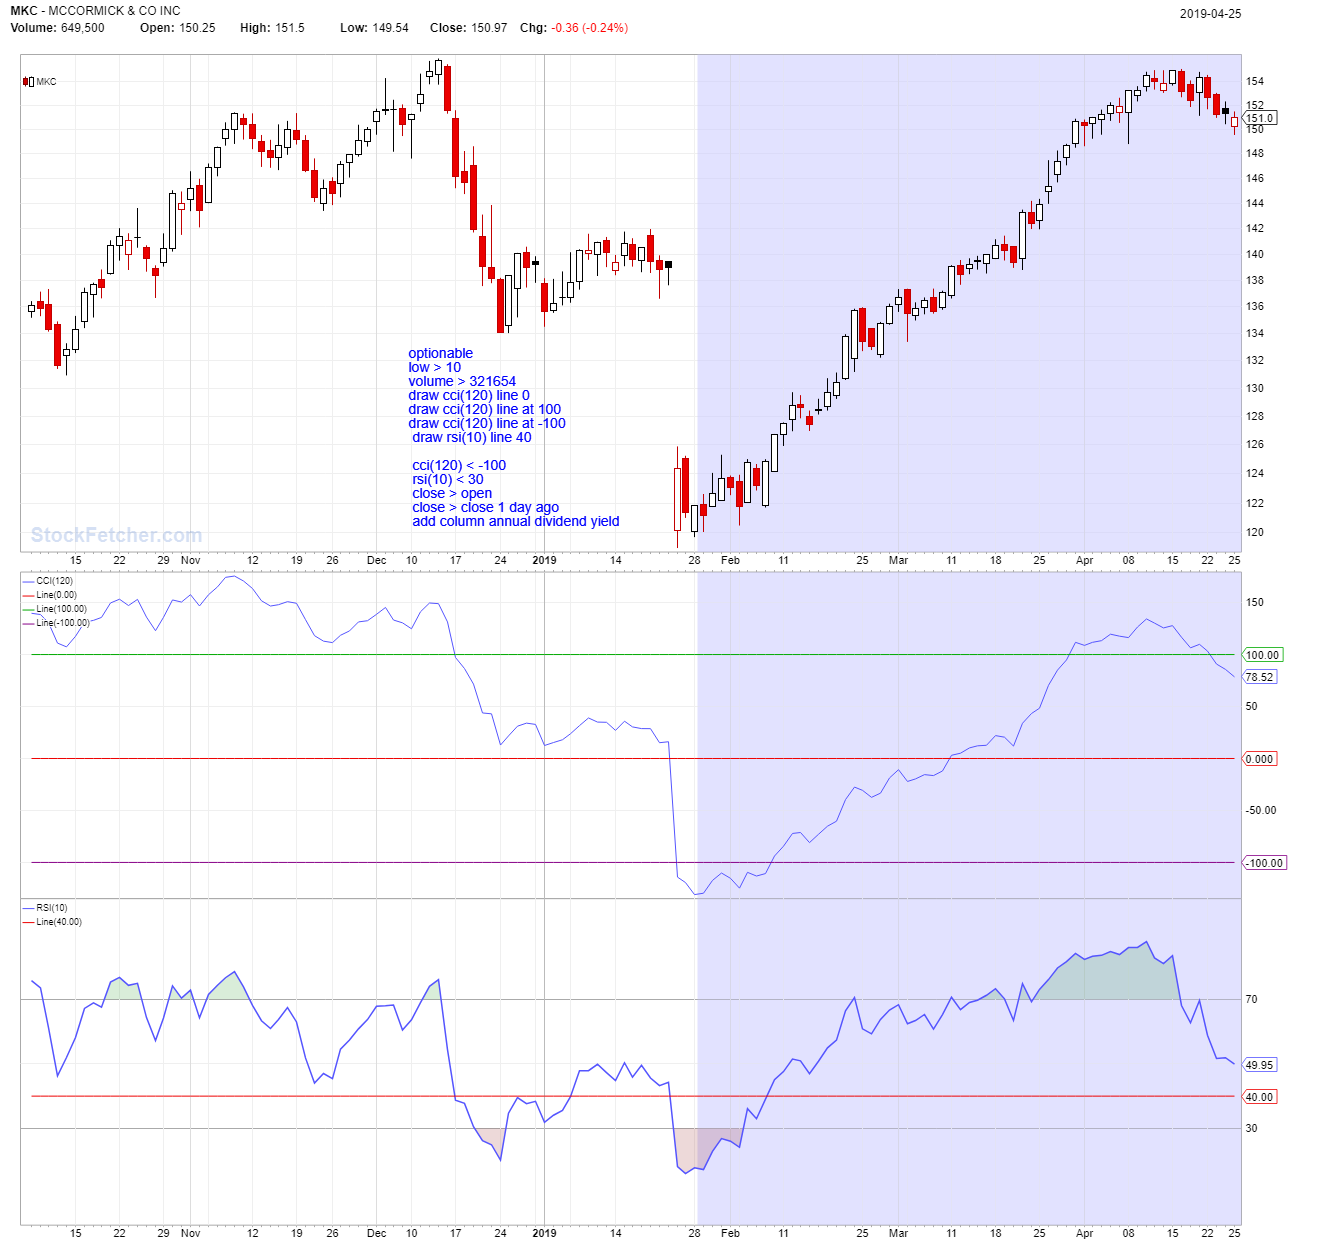 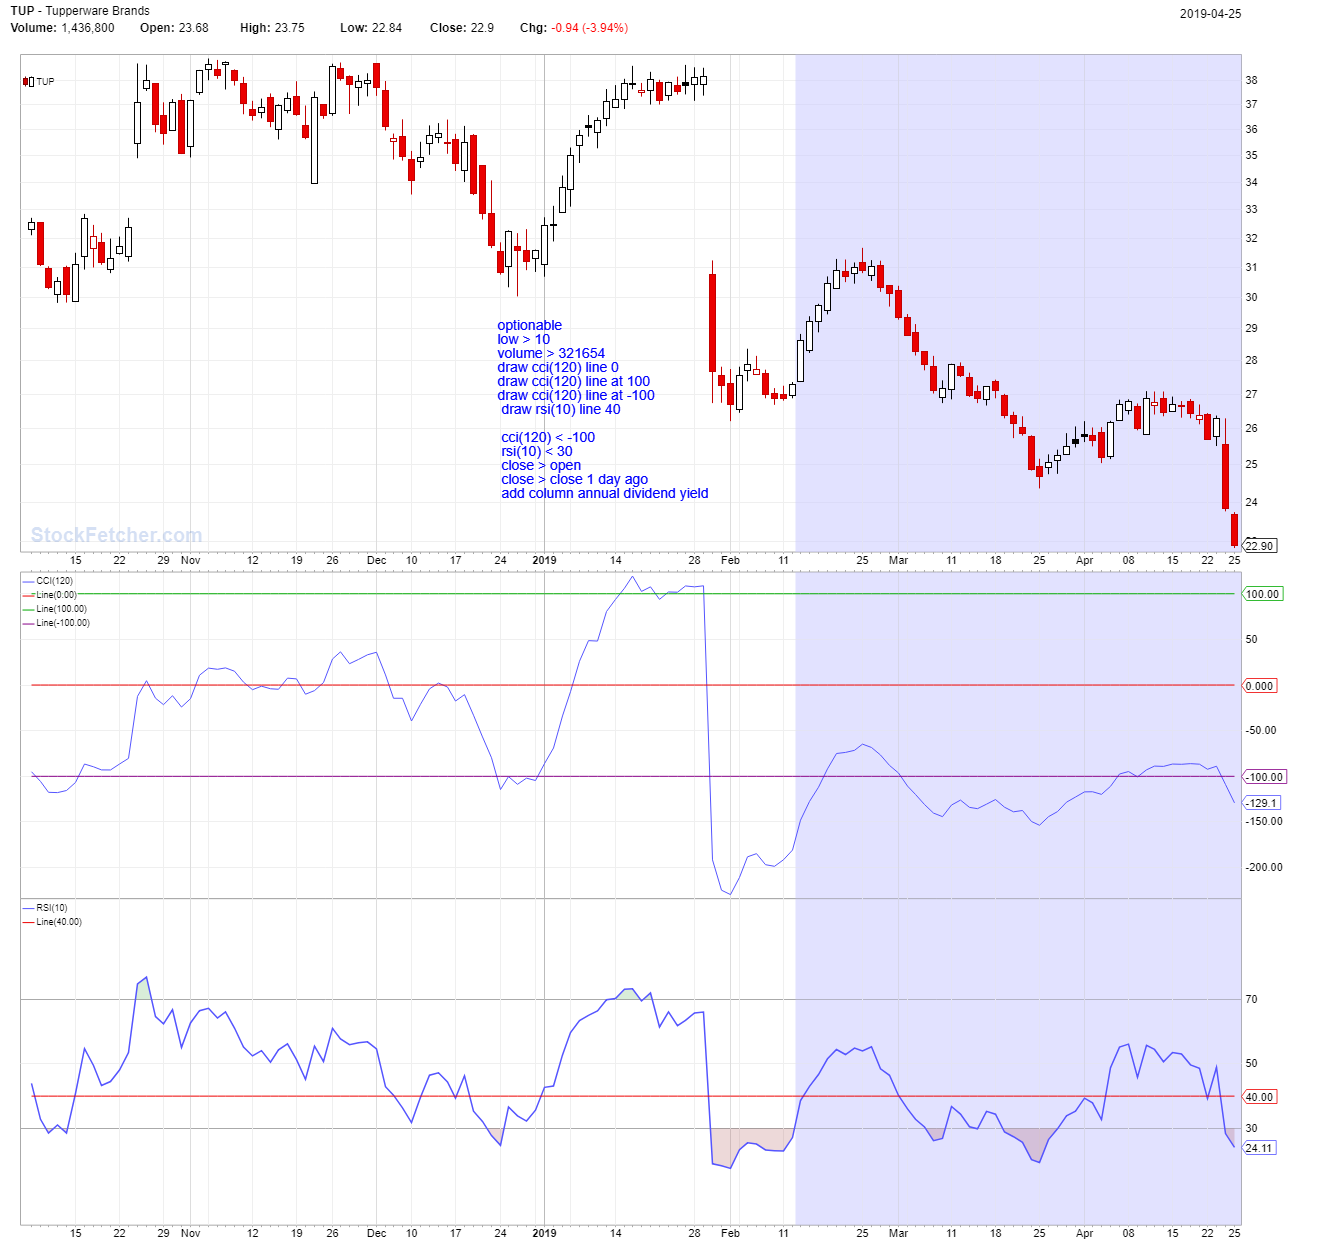 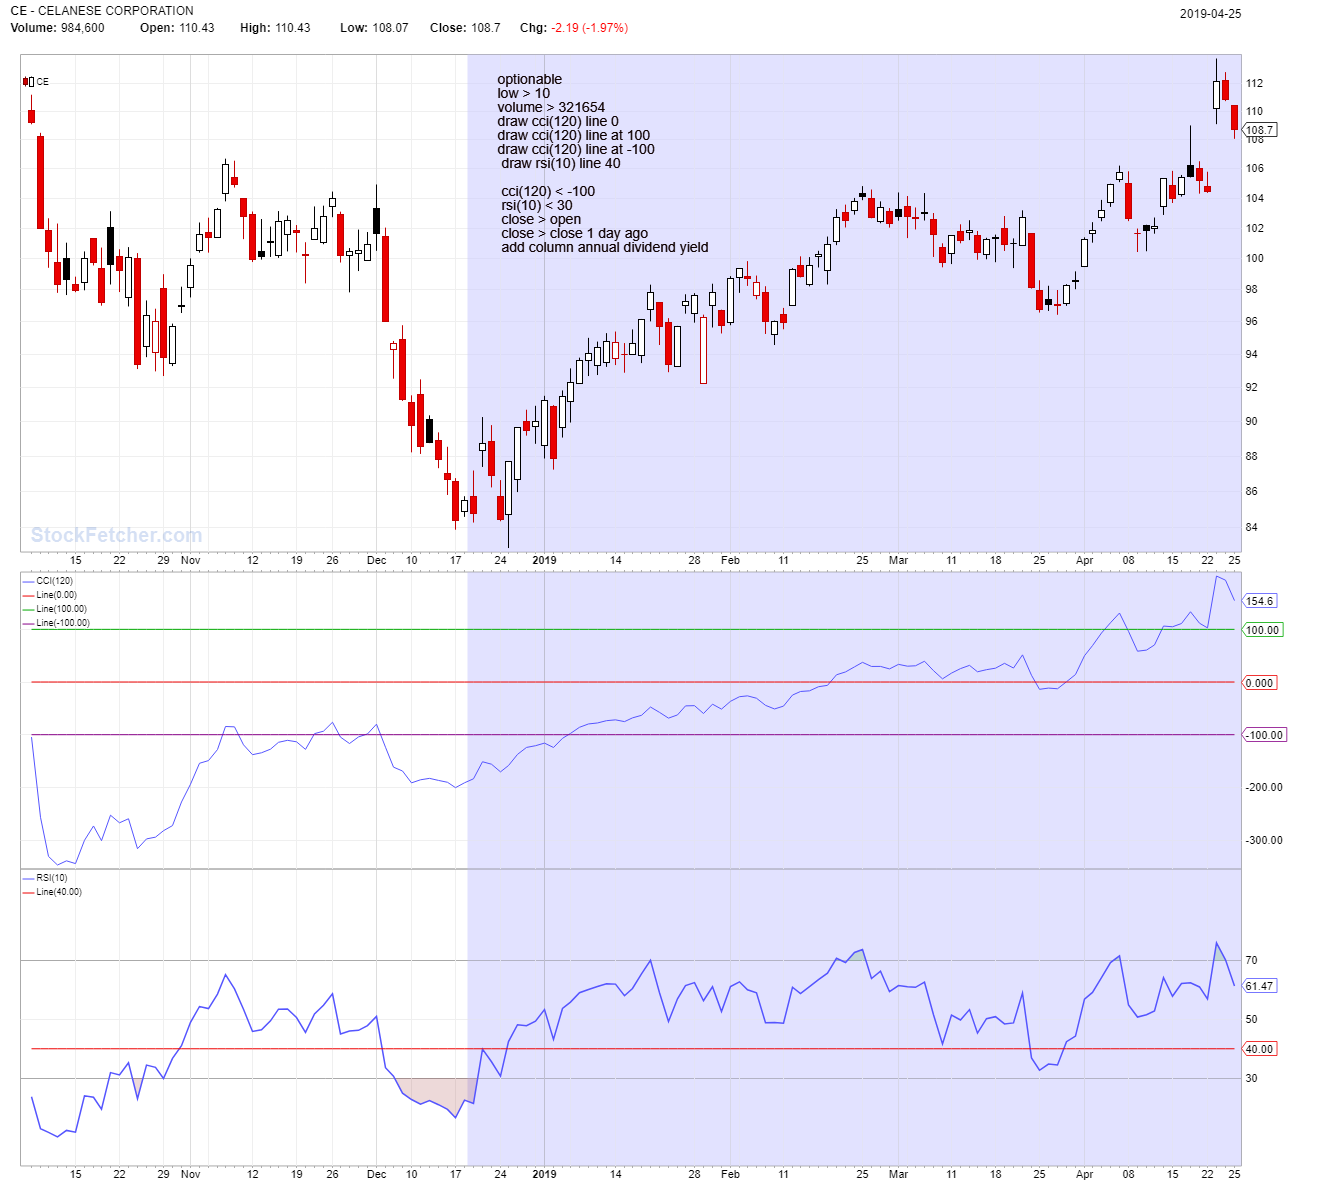 |
| Cheese 1,374 posts msg #147560 - Ignore Cheese |
4/25/2019 10:55:04 PM Thank you very much for the update, Four. |
| four 5,087 posts msg #147563 - Ignore four modified |
4/26/2019 1:37:20 AM Let's not forget the buying opportunity of the end of 2018 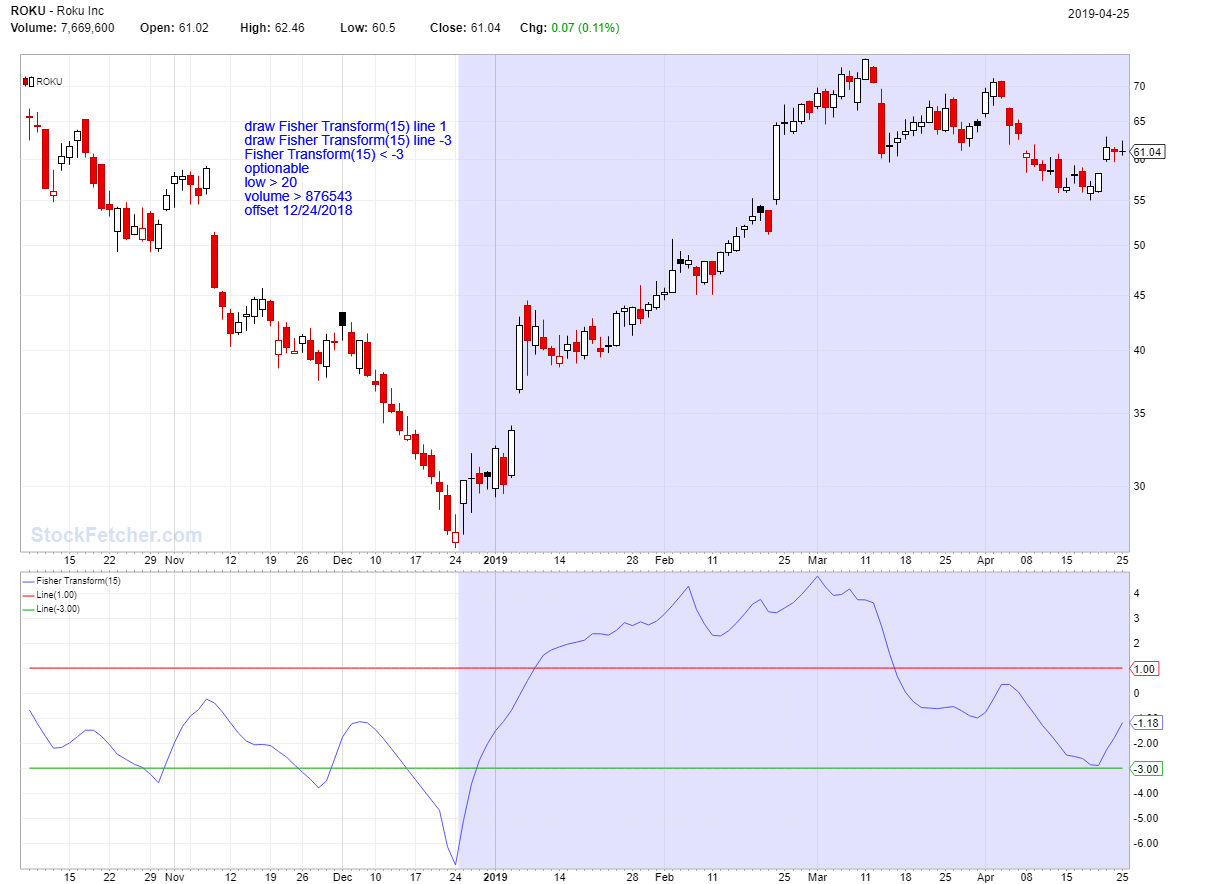 |
| Cheese 1,374 posts msg #147564 - Ignore Cheese |
4/26/2019 1:49:41 AM Thanks again, Four. How would you scale in ? |
| StockFetcher Forums · Filter Exchange · Best of Four | << 1 2 >>Post Follow-up |